
Test Yourself
Q1: Multiple Choice Type
i. The number of times a data, in the set, occurs is called:
Step 1: In statistics, when a value appears repeatedly in a data set, we count how many times it occurs.
Step 2: This count of occurrences of a particular observation is called its frequency.
Answer: c. Frequency
ii. The difference between the greatest and the smallest values of observations is called:
Step 1: Identify the largest and the smallest values in the data.
Step 2: The difference between them is called the range.
Step 3: Formula:
\(\text{Range} = \text{Maximum value} – \text{Minimum value}\)
Answer: b. Range
iii. The difference between the upper and lower class-limits of a class-interval is called:
Step 1: A class interval has two limits:
Lower class-limit and Upper class-limit.
Step 2: The difference between them gives the size or width of the class interval.
Step 3: Formula:
\(\text{Class width} = \text{Upper limit} – \text{Lower limit}\)
Answer: a. Width of the class-interval
iv. In a bar-graph, if the widths of all bars are kept same, their heights are proportional to their:
Step 1: In a bar graph, each bar represents a quantity or number of occurrences.
Step 2: When the widths of bars are equal, the heights represent the values of the data.
Step 3: In statistical graphs, these values usually represent the frequency of observations.
Answer: d. Frequency
v. In a pie-chart, the angle corresponding to different components is:
Step 1: A pie-chart represents the data as parts of a circle.
Step 2: The full circle represents \(360^\circ\).
Step 3: The angle for each component depends on its proportion in the total value.
Step 4: Formula:
\(\text{Angle of component} = \frac{\text{Value of the component}}{\text{Total value of all the components}} \times 360^\circ\)
Answer: a. \(\frac{\text{Value of the component}}{\text{Total value of all the components}} \times 360^\circ\)
vi. Consider the following class intervals of a grouped data:
Statement 1: Class mark of the 3rd class interval is 46.5.
Statement 2: If the class mark of the 2nd class interval is 77.5, the class interval is 60-85.
Which of the following options is correct?
| Class Interval | 10-25 | 25-40 | ……. | 55-70 |
|---|
Class Interval: \(10-25,\; 25-40,\; \ldots,\; 55-70\)
Step 1: Determine the third class interval.
Given pattern:
\(10-25\)
\(25-40\)
\(40-55\)
\(55-70\)
So the third class interval is \(40-55\).
Step 2: Find its class-mark.
\(\text{Class-mark} = \frac{\text{Upper limit} + \text{Lower limit}}{2}\)
\(\text{Class-mark} = \frac{55 + 40}{2}\)
\(\text{Class-mark} = \frac{95}{2}\)
\(\text{Class-mark} = 47.5\)
So statement 1 says \(46.5\), which is incorrect.
Hence, Statement 1 is false.
Step 3: Check statement 2.
Given class-mark \(= 77.5\)
\(\text{Class-mark} = \frac{\text{Upper limit} + \text{Lower limit}}{2}\)
Assume class interval \(60-85\).
\(\frac{60 + 85}{2} = \frac{145}{2} = 72.5\)
But given class-mark \(= 77.5\), which does not match.
Hence, Statement 2 is also false.
Answer: b. Both the statements are false
vii. Assertion (A): If in a pie chart representing the number of students opting for different streams in college admission out of a total admission of \(3300\), the central angle for the sector representing Mathematics is \(48^\circ\), then the number of students who opted for Mathematics is \(440\).
Reason (R): \( \text{Central angle for sector (Component)} = \left(\frac{\text{Value of the component}}{\text{Total value}}\times360\right)^\circ \)
Step 1: Use the pie-chart formula.
\(\text{Central angle} = \frac{\text{Value}}{\text{Total}} \times 360^\circ\)
Step 2: Substitute the values.
\(48 = \frac{\text{Value}}{3300} \times 360\)
Step 3: Solve for the value.
\(\text{Value} = \frac{48}{360} \times 3300\)
\(\text{Value} = \frac{2}{15} \times 3300\)
\(\text{Value} = 440\)
So the assertion is correct.
Step 4: The reason states the correct formula used in the calculation.
Answer: a. Both A and R are correct, and R is the correct explanation for A
viii. Assertion (A): Class size of the following class intervals is \(10\). \(1-10,\; 11-20,\; 21-30,\; \text{etc.}\)
Reason (R): The difference between the upper limit and lower limit is class size.
Step 1: Class size formula:
\(\text{Class size} = \text{Upper limit} – \text{Lower limit}\)
Step 2: For class interval \(1-10\):
\(\text{Class size} = 10 – 1\)
\(\text{Class size} = 9\)
So the class size is \(9\), not \(10\).
Hence, the assertion is false.
Step 3: The reason correctly states the definition of class size.
Answer: d. A is false, but R is true
ix. Assertion (A): The given bar graph shows six mountain peaks. The ratio of height of the highest to the lowest peak is \(3.2\).
Reason (R): The space between consecutive bars may be of any suitable value, but the spaces between all the consecutive bars must be the same.
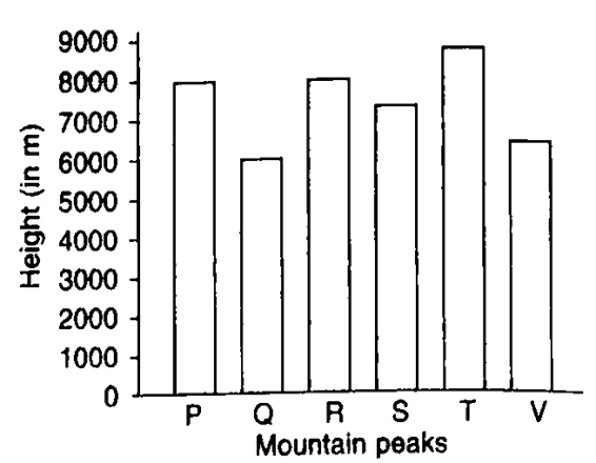
Step 1: Observe the heights of the mountain peaks from the bar graph.
Peak \(P = 8000\,m\)
Peak \(Q = 6000\,m\)
Peak \(R = 8000\,m\)
Peak \(S = 7500\,m\)
Peak \(T = 9000\,m\)
Peak \(V = 6500\,m\)
Step 2: Identify the highest and the lowest peaks.
Highest peak \(= T = 9000\,m\)
Lowest peak \(= Q = 6000\,m\)
Step 3: Find the ratio of their heights.
\(\text{Ratio} = \frac{9000}{6000}\)
\(\text{Ratio} = 1.50\)
Since \(1.50 = 3 : 2\), the assertion is correct.
Step 4: Check the reason.
In a bar graph, the spacing between consecutive bars may be chosen conveniently, but the spacing between all bars must remain equal to maintain uniformity.
Hence, the reason is correct.
Answer: b. Both A and R are correct, and R is not the correct explanation for A
x. Assertion (A): The distribution of land in Pacific Housing Society is shown in the pie chart. The total land area for the project is \(144000\;m^2\). The ratio of the area kept open to the area for apartment construction is \(5:13\).
Reason (R): In a pie chart, the central angle of a sector subtended by its arc is proportional to the value it represents.
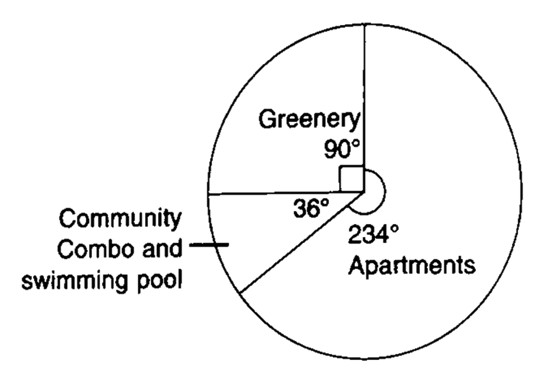
Step 1: Observe the central angles in the pie chart.
Greenery \(= 90^\circ\)
Community combo and swimming pool \(= 36^\circ\)
Apartments \(= 234^\circ\)
Step 2: Find the open land area.
Open land includes:
Greenery \(+\) Community combo and swimming pool
Total open land angle:
\(90^\circ + 36^\circ = 126^\circ\)
Step 3: Compare open land with apartment area.
Apartment angle \(= 234^\circ\)
Ratio:\(\text{Open land : Apartment} = 126 : 234\)
Step 4: Simplify the ratio.
\(\frac{126}{234}\)
Divide both by \(18\):
\(126 \div 18 = 7\)
\(234 \div 18 = 13\)
So the ratio becomes \(7:13\).
Hence, the assertion stating \(5:13\) is incorrect.
Step 5: Check the reason.
In a pie chart, each sector angle represents a proportion of the total \(360^\circ\).
Therefore, the central angle of a sector is proportional to the value it represents.
So the reason is correct.
Answer: d. A is false, but R is true
Q2: Draw a bar-graph to represent the following data:
| Articles : | A | B | C | D | E | F | G |
|---|---|---|---|---|---|---|---|
| Price of articles: | 200 | 250 | 150 | 150 | 100 | 50 | 350 |
Step 1: Identify the Axes
Horizontal Axis (X-axis): Articles (A, B, C, D, E, F, G)
Vertical Axis (Y-axis): Price of articles (in ₹)
Step 2: Choosing a Scale
The maximum price is ₹350 and the minimum is ₹50.
We choose a scale where 1 unit length = ₹50.
Scale on Y-axis: 0, 50, 100, 150, 200, 250, 300, 350, 400.
Step 3: Rendering the Bar Graph
Step 4: Comparative Observation
• Article G has the highest price (₹350) > Article B (₹250).
• Article F has the lowest price (₹50) < Article E (₹100).
• Articles C and D have equal prices (₹150).
• Article B (₹250) > Article A (₹200).
Answer: The bar graph effectively represents the price distribution of seven different articles. Article G is the most expensive item (₹350), while Article F is the least expensive (₹50). The Y-axis follows the chosen scale of 1 unit length = ₹50, with markings from 0 to ₹400.
Q3: Study the given graph and then answer the following questions
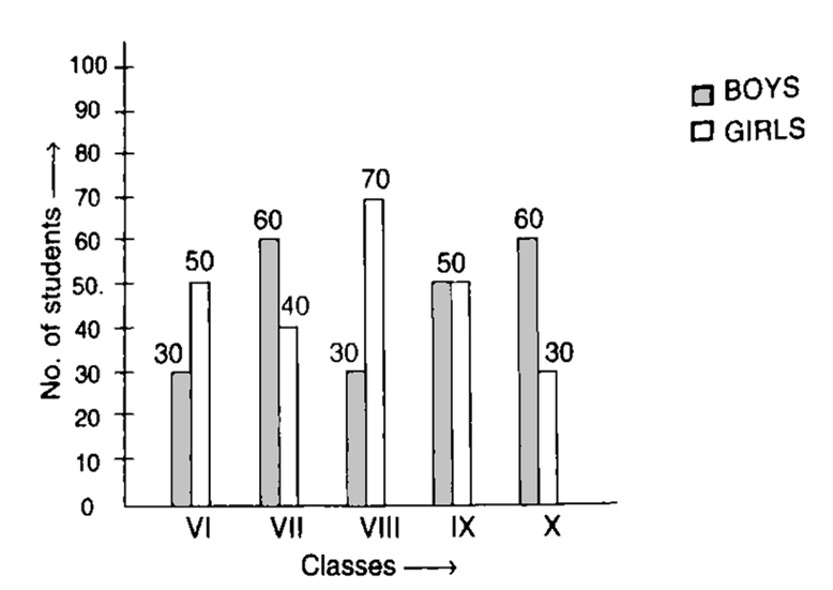
i. Which classes have the larger number of students?
Step 1: Read the values of boys and girls from the bar graph.
Class VI: Boys \(=30\), Girls \(=50\)
Class VII: Boys \(=60\), Girls \(=40\)
Class VIII: Boys \(=30\), Girls \(=70\)
Class IX: Boys \(=50\), Girls \(=50\)
Class X: Boys \(=60\), Girls \(=30\)
Step 2: Find the total students in each class.
Class VI \(=30+50=80\)
Class VII \(=60+40=100\)
Class VIII \(=30+70=100\)
Class IX \(=50+50=100\)
Class X \(=60+30=90\)
Step 3: The largest total number of students is \(100\).
Answer: Classes VII, VIII and IX have the larger number of students.
ii. Which class has the equal number of girls and boys?
Step 1: Check each class where number of boys and girls are the same.
Class VI: \(30 \neq 50\)
Class VII: \(60 \neq 40\)
Class VIII: \(30 \neq 70\)
Class IX: \(50 = 50\)
Class X: \(60 \neq 30\)
Answer: Class IX has equal number of boys and girls.
iii. What is the total number of students in class VIII?
Step 1: From the bar graph.
Boys in class VIII \(=30\)
Girls in class VIII \(=70\)
Step 2: Find the total.
Total students \(=30+70\)
Total students \(=100\)
Answer: Total number of students in class VIII \(=100\).
iv. What is total number of students (from the class VI to class X)?
Step 1: Find the total students in each class.
Class VI \(=30+50=80\)
Class VII \(=60+40=100\)
Class VIII \(=30+70=100\)
Class IX \(=50+50=100\)
Class X \(=60+30=90\)
Step 2: Add all totals.
Total \(=80+100+100+100+90\)
Total \(=470\)
Answer: Total number of students from class VI to class X \(=470\).
Q4: The following table shows the number of students in various classes. Draw a pie-graph to represent the above data.
| Class | VI | VII | VIII | IX | X |
|---|---|---|---|---|---|
| No. of students | 360 | 300 | 54 | 150 | 216 |
Step 1: Calculate Central Angles
Formula: Central Angle = (No. of Students / Total Students) × 360°
1. Class VI : (360 / 1080) × 360° = 120°
2. Class VII: (300 / 1080) × 360° = 100°
3. Class VIII: (54 / 1080) × 360° = 18°
4. Class IX : (150 / 1080) × 360° = 50°
5. Class X : (216 / 1080) × 360° = 72°
Check Total Angle: 120° + 100° + 18° + 50° + 72° = 360°
Answer: The pie-graph effectively represents the number of students in various classes. Class VI covers the largest area with a 120° angle, while Class VIII covers the smallest area with an 18° angle. The total of all central angles is 360°, which confirms the complete circle representation.
Q5: The given pie-graph represents the number of students in different classes. If the total number of students is \(1080\), find the number of students in each class.
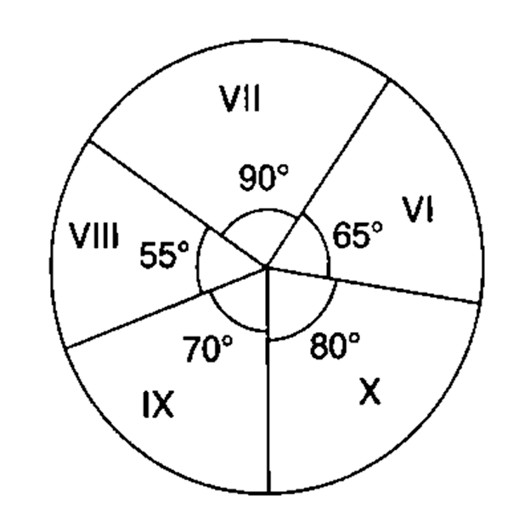
Step 1: Write the central angles for each class from the pie chart.
Class VI \(=65^\circ\)
Class VII \(=90^\circ\)
Class VIII \(=55^\circ\)
Class IX \(=70^\circ\)
Class X \(=80^\circ\)
Step 2: Total angle of a pie chart.
\(\text{Total angle} = 360^\circ\)
Step 3: Use the formula for number of students.
\(\text{Students in class} = \frac{\text{Central angle}}{360} \times 1080\)
Class VI
Students \(=\frac{65}{360}\times1080\)
Students \(=65\times3\)
Students \(=195\)
Class VII
Students \(=\frac{90}{360}\times1080\)
Students \(=90\times3\)
Students \(=270\)
Class VIII
Students \(=\frac{55}{360}\times1080\)
Students \(=55\times3\)
Students \(=165\)
Class IX
Students \(=\frac{70}{360}\times1080\)
Students \(=70\times3\)
Students \(=210\)
Class X
Students \(=\frac{80}{360}\times1080\)
Students \(=80\times3\)
Students \(=240\)
Step 4: Verify the total number of students.
\(195+270+165+210+240=1080\)
Answer: Class VI \(=195\)
Class VII \(=270\)
Class VIII \(=165\)
Class IX \(=210\)
Class X \(=240\)

Leave a Comment